Search Strategies
Once we know what to look for and the dimensions of the haystack it may be hiding in (see Waterhole) it’s time to develop an arsenal of tools to find it.
SETI Net runs on the concept of Falsification. This is the idea that for a hypothesis to be promoted to a scientific theory it must be falsifiable. This section defines the use of falsification and describes how the system uses this strategy..
Falsification
In the area of the philosophy of science Karl Popper is well known. His idea that for a hypothesis to be considered to be scientific it must be able to be proven false. A well-known example of this is the Black Swan:
“One notices a white swan. From this one can conclude:
At least one swan is white.
From this, one may wish to conjecture:
All swans are white”.
Notice that there is no practical way to prove this conjecture to be true unless you examined each and every swan on Earth. Not only on Earth but in the universe. But the conjecture is easy to prove wrong simply by observing one non-white swan. No need to continue looking throughout the universe after finding that single swan.
When a SETI Net station collects a candidate signal it sets about looking for the non-whiteness of the signal – It attempts to falsify it. It does this through a series of conditional tests. These tests take the form:
Hypotheses:
There is a signal at frequency X that is from ET
The falsification is then:
The signal at frequency X is not ET because of condition Y
If the hypotheses cannot be falsified because of Y it is subjected to Y+1 and so on until you run out of Y’s. Then the hypotheses remains un-falsified. It never becomes true.
This seems counter intuitive and it is. After all the system is called the Search which implies success at some point, that the signal at X really is an ET, but look at it from a practicable point of view. If a signal is subjected to all the conditional tests available to this SETI station and it still passes, the next logical step would be to refer it to a second station, where it could be subjected to a different set of conditions. If it passes those as well, it should be sent to a third and then fourth until you run out of stations. This still only tells you that you have not found or invented a conditional test to falsify it.
After passing all known tests, the hypothesis becomes a scientific theory. Wikipedia defines it this way:
A scientific theory is a well-substantiated explanation of some aspect of the natural world, based on a body of facts that have been repeatedly confirmed through observation and experiment. Such fact-supported theories are not "guesses" but reliable accounts of the real world.
If a later, newly devised test disproves the hypothesis it then becomes falsified.
The hypothesis comes from the search software itself as it manipulates the hardware components of the station. For example: during a long search run the station detects a signal that fits some of the criteria of what an ET could be sending; It’s narrow band, not too strong and in the expected part of the spectrum. The station then switches to falsification mode in an attempt to find that this is NOT from ET. The station does not switch to a mode to prove that it IS from ET, in fact there is no mode like that to switch to. The station is applying the Popperian process of falsification to the hypothesis.
Basic Detection
The Spectrum Analyzer is a stand alone module written to run exclusively on Windows 64-bit operating system. It is also an HTTP server that can be directed by its client, the SETI Control panel. This allows the Spec Ana to run on a different machine or in a different location.
The basic detection process is performed completely within the Spec Ana and will run without the SETI Control panel at all. It does the heavy lifting, bit shoving and signal line detection by itself. This is how that happens.
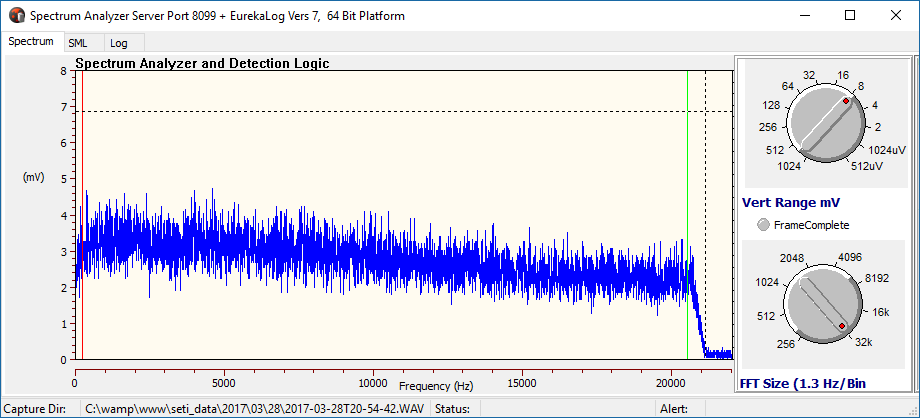
The Spec Ana software captures the output of the connected receiver and builds a buffer of ‘lines’. Each line is a capture of a 20 KHz wide segment of the tuned frequency. That capture is digitized, put through a 32 K point FFT and presented on the display of the Spec Ana. The above figure shows one captured line. At this resolution, each line consists of 16 K bins of signal amplitude and each bin corresponds to 1.3 Hz of the original 20 KHz segment. That is one line.
Each of these lines of raw digitized receiver output is placed in a buffer as they come in. The buffer is 16 K wide and normally 20 K deep of integer values. The buffer makes up one ‘Frame’ of data. The number of Lines per Frame can be selected to fit the falsification scenario but the station can collect about 10 Lines / second. A typical frame buffer 20,000 deep will take a little more than a half hour to fill.
A frame buffer can be quite large. A typical half hour run at one 20 Hz segment of the band will require a frame buffer of 20,000 * 16,000 * 4 (integers are 4 bytes each) or about 1.3 Gig bytes of main memory. An array like this can only be managed with a Windows 64-bit operating system that allows manipulation of large arrays.
After the frame buffer is instantiated and cleared in memory the Spec Ana will go about filling it.
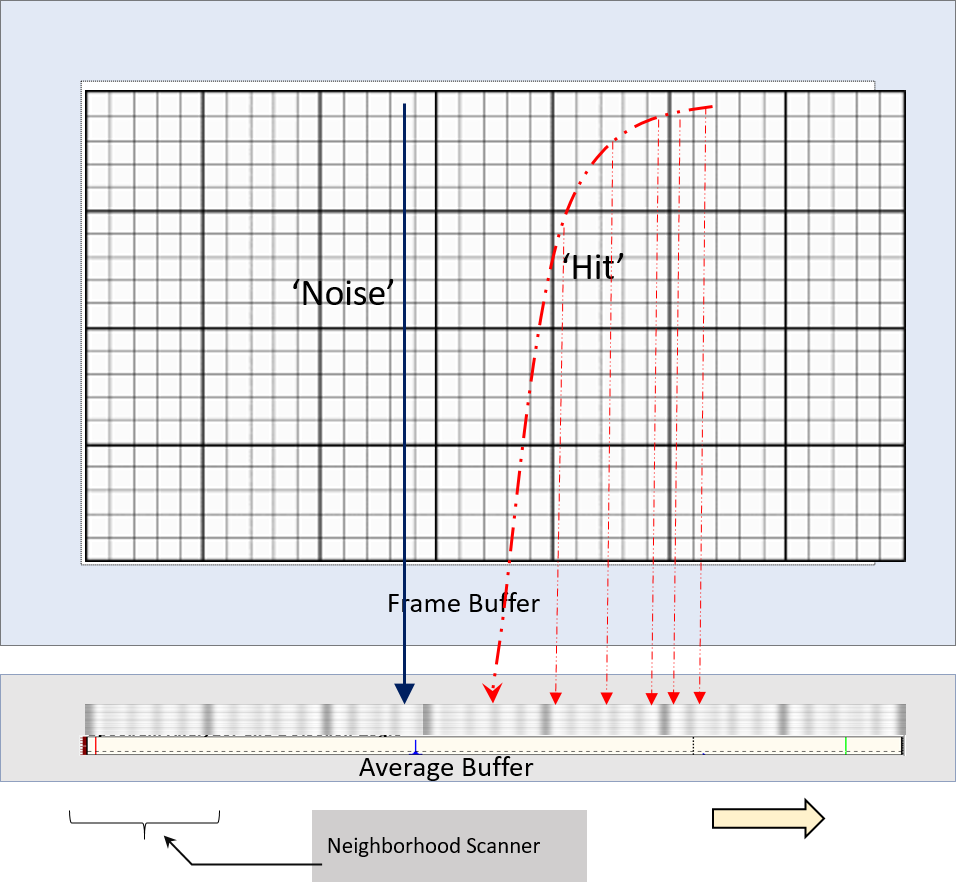
This figure shows how noise is distributed in the Frame Buffer and what a Hit looks like. Why this is useful is described in the section 'Chirp' >
Frame Buffer Search
Filling the Frame Buffer will require up to 20 minutes, depending on the Lines Per Frame setting. During this time the Antenna will keep the target in line and the integration algorithm will pull any signal out of the noise that it can.
As the Frame Buffer is being filled each line is also used to construct a WAV file and a JPG file. Twenty minutes of signal will create about 50 Meg of WAV and a JPG. The JPG would be far too large to render, so it is constantly overwritten every few minutes.
At the end of filling the buffer the Frame Buffer search takes place.
Each column of raw signal amplitude bins is averaged and placed in the Average Buffer. The neighborhood scanner function then comes on and slides a window of Segment Size width across the buffer. For each bin in the Average Buffer the scanner averages the bins to the left and right in the segment neighborhood and then compares this value with the signal amplitude in the center bin.
If the result is greater than the threshold, a ‘Hit’ is logged. The operator is signaled by playing the Sound of a Hit, the WAV and JPG files are finalized and then tagged with the SETI Markup Language (SML) XML data. The embedded SML completely defines the state of the station when the Hit was found and allows the station to proceed without the operator being concerned with saving the files and keeping notes. The ‘Hit’ is moved to the MySQL database on the main SETI Net server immediately. The WAV and JPG files are moved to a temporary local location, ready to be batch moved to the server when time permits.
The Spec Ana then goes on to collect more data about the Hit. Five more Frame Buffers are created, along with their WAVs and JPGs. These are moved to the main server and the files saved along with the original Hit. Therefore a complete Hit, at the maximum Lines Per Frame of 20,000, requires one hour twenty minutes to complete.
At this point the Spec Ana halts and waits for a restart from the operator or, more likely, from the controlling SETI Control Panel.
Setup Parameters
The following settings are available to the operator over the Frame Buffer
- Lines Per Frame – The number of lines to collect for one Frame
- Integration – The time to integrate each of incoming samples
- Segment Size – The size, in bins, of the neighborhood to be scanned
- Line Limit – The maximum signal acceptable as a candidate ‘Hit’
- Threshold – The trigger level applied by the ‘hood scanner
Integration
Receiver signal is digitized by the station sound card and routed through the Spec Ana FFT. The FFT output is then integrated. Integration improves the signal to noise level greatly, but it is not a free lunch. I generally run the integration at 25 – 30 seconds which will pull very small signals from the mud. If I increase integration time to more than about 100 seconds the data in the Frame Buffer will be ‘flattened’ to the point of being unusable. This is because the Frame Buffer Search software depends on bin-to-bin differences in amplitude to make its decision. Too much integration defeats the process.
Line Limiting
The fully operational system moves the receiver up band at a predetermined rate, scanning as it goes, and sooner or later it will run into a patch of junk signals. These can usually be traced to local signal sources that software would have to treat individually as possible ET. This would cause the station to spend an inordinate amount of time processing signals. Fortunately, this type of signal has one characteristic that makes it identifiable and ignorable – it is usually very strong.
The operator can set a maximum amplitude for each Bin that if exceeded will cause the signal to be ignored.
Hit Threshold
The point at which a neighborhood limit test is determined to be a Hit is set by the operator. I like to use 20% but this is not hard and fast. More integration will allow a lower value because the Frame Buffer will be flatter.
SETI Control Panel
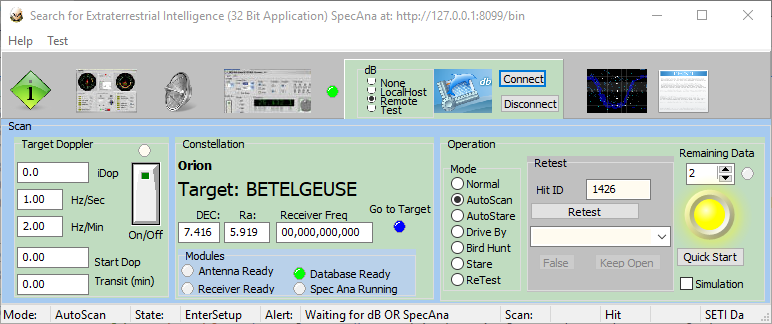
The heavy lifting of basic detection is done completely in the Spectrum Analyzer but the SETI Control Panel is what makes sense of it all. This module is an HTTP client to the Spec Ana server so it can be located in a different computer.
It’s with this module that the following extended detection logic takes place
- Antenna Station Keeping – For long duration integration with large Frame Buffers the antenna must be kept trained on the target
- Target Doppler – This makes use of the Doppler effect of the Earth’s rotation for detection
- Birds – All systems have areas of the spectrum that are simply useless to scan because of self-generated spurs
- Antenna Off Axis – One useful technique to falsify a ‘Hit’ is to move the antenna away from the signal and verify that It disappears. If it does not, it is a local signal of some sort.
- Receiver Image – When the receiver front end is being swamped by an out of band signal, one of the symptoms is that when the frequency is moved up the detected signal moves up as well. Normally it moves down
- Filter On/Off – The system allows the Band Pass Filter to be switched in and out. A signal that is outside the filter band pass should drop down by a very large amount when the filter is switched On.
Antenna Station Keeping
The earth rotates to the East at a constant (thankfully) rate of 15 degrees per hour so that at the end of a 24-hour day (24 * 15 = 360 deg) its back where it started. During this period, it also progresses in its path around the sun and this causes the stars, the targets in SETI Net, to appear to move as well. This sidereal day is just a bit shorter than a standard day by about 4 minutes. To keep the SETI net antenna pointed at a single target is the job of three modules in the system: The Mount, The Antenna and the Sky Map.
Mount
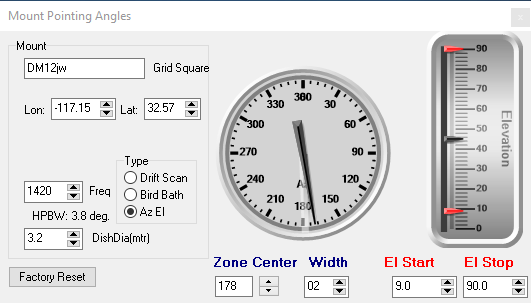
The Mount is where the location on Earth is defined as well as the type of mount (Drift, Birdbath or AzEl). Its used to set the Lat/Lon of the station, the nominal frequency in use so that the HPBW can be calculated from the Dish Diameter.
It defines the ‘No Fly’ zone of the mount. That is the mechanical stop that restricts that antenna movement to less than 360 Azimuth so that it does not’t wring its own neck at the end of travel. It can be adjusted to match the current antenna mount setup.
The Red arrows define the minimum and maximum Elevation. The two red arrows show this to be about +6 degrees to 90 degrees.
Antenna
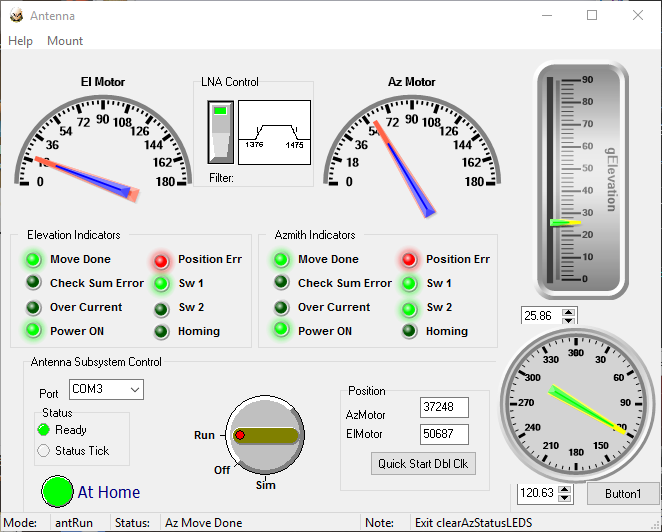
The Antenna module manages the movement of the antenna itself. The Az and El dials on the right side are used to set the needed physical position of the antenna and drive the rotor motors to the correct location. It also controls the band Pass Filter in or out of the system.
When the Antenna is first started the operator presses the At Home button (shown Green here) and the rotor motors are commanded to move to a known home location, in this case due south. Once home the Antenna becomes ‘Ready’ and can be commanded from the Sky Map
Sky Map
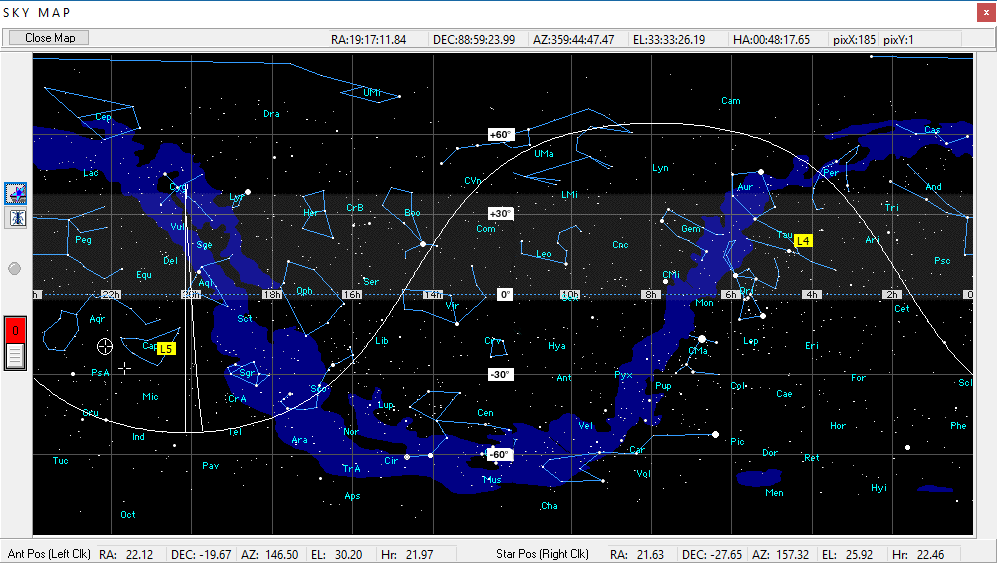
This module is responsible for commanding the Antenna to move to the target location in terms of DEC and Ra. The large white ‘spike’ on the image is the result of the ‘No Fly’ zone in the Mount. The sine wave looking figure is the horizon of the antenna. It makes a sine wave because of the use of a Mercator projection of the sky. The entire white figure moves from right to left during a sidereal day.
The Sky Map is also responsible to keep the Antenna locked to the target. It recalculates the needed Az and El of the Antenna second by second and sends a move command when the target is on the edge of the HPBW of the antenna.
On this image the antenna current position is shown on the left side by a circle (the HPBW). The current target is shown by a cross just below it. When they lock, the symbols overlap.
Chirp
Chirping is the principal technique to sift local Earth bound signals, on land or orbiting above, from possible ET beacons. It makes use of the Earth’s rotation for the task.
When you think of chirp you think of a bird’s song. This chirp is a like that except that the chirp is always down at a calculated rate and is *very* slow on the order of 0.1 Hz / second.
Doppler on Earth
There is a common misunderstanding of the effect of Doppler shift. People seem to think that the approaching ambulance siren pitch gets higher and higher as it approaches you and then gets lower and lower as it moves away. This is not the case. Actually, the pitch *always* goes lower as it approaches you.
Think of it this way. You are not an ambulance siren expert so you don’t know what the pitch is supposed to be but a mile or so away one is approaching you. As long as it is not accelerating in its path toward you the pitch will remain the same. As it passes you the pitch will suddenly drop and remain at the lower pitch as it moves away from you.
If the drop in frequency is *very* sudden it will mean that the ambulance has just run over you. The Astronomer John Dobson explained the effect thus:
“The reason the siren slides is because it does not’t hit you.”
Normally getting run over is not the case. If the ambulance is moving at an angle to you its radial velocity does not remain constant but instead varies as a function of the angle between your line of sight and the siren by:
V(radial) = V(s) * cos(angle)
Where 'angle' is between the ambulances forward velocity and your line of sight.
Therefore, as the ambulance moves toward you at an angle, its siren will fall from higher than its actual pitch until it is at a right angle to you. At that point what you hear is its actual frequency. Then as it proceeds past you the pitch continues to fall until is out of hearing range.
It always falls.
Earths Doppler
This same effect is put to use to sort signals that are local, on Earth or orbiting overhead, from possible signals from an ET.
Consider a far distant target. The SETI antenna is pointing due East but the target is below the horizon. The target rises and its beacon is detected. What frequency is that beacon being transmitted on? We are not exactly sure, but we do know that because of the rotation of the Earth it appears to us to be higher than it actually is. The SETI antenna is in tracking mode so it keeps the target in its beam.
As the target rises higher and higher the frequency will fall just as the siren does on Earth. When the target is directly overhead, the beacon is at is actual frequency. As it moves further to the West it continues to fall until it finally sets.
Back in the description of the Frame Buffer there is an image with a blue and a red lines. The blue line represents how the vertical columns of a local signal are filled. The maximum amplitude is saved in the single bin. The red lines however are spread across many bins. When the Frame Buffer is completely filled and the Spec Ana search algorithm comes on, it will find the blue bin with a high degree of accuracy and it will miss the spread out red bins every time.
How to tell the difference?
One approach would be to know the Doppler shift of the Earth at each collection time and adjust the placement of the amplitude to the correct bin. This would be a rather time consuming and calculation intensive operation. A better way is to adjust the received frequency in step with the Doppler. That is how it’s done in the SETI Net software. During the search phase the Doppler shift is calculated from the Antennas Az/El through a set of Trig function’s and the known location of the station on Earth. The receiver is then adjusted down in frequency one Hz at a time as the tracking system moves ahead.
The end result is that the ET beacon is contained in one bin and the local signals are smeared over the buffer and will be ignored.
For this technique to be effective the bin shift must move by more than the size of the neighborhood scanned. The calculated shift of a target at an angel to direct East is on the order of 0.08 Hz/ sec so a 20,000-line Frame Buffer that fills at 10 lines/second will be bin shifted:
BinShift = (20,000/10)* -0.08
or -160 Bins
This 160 bins are plenty to allow the smearing and concentration needed to take place.
Therefore the receiver will be started at a specific frequency and while collecting data will be shifted down in frequency. After a full 20,000 lines have been collected it will have moved down 160 bins or about 200 Hz (at 1.3 Hz/bin). At the end of a complete scan, the receiver is moved up to the next 20 KHz segment and the process repeated.
This technique is very effective. A single simulated signal, chirped down at a rate in step with the calculated receiver chirp can be detected in a thicket of local signals.
Summary
(TBD)
REFERENCES
'Choosing a Maximum Drift Rate in a SETI Search: Astrophysical Considerations' by Sheikh, Wright, Seimion and Enriquez