Operating Block Diagram
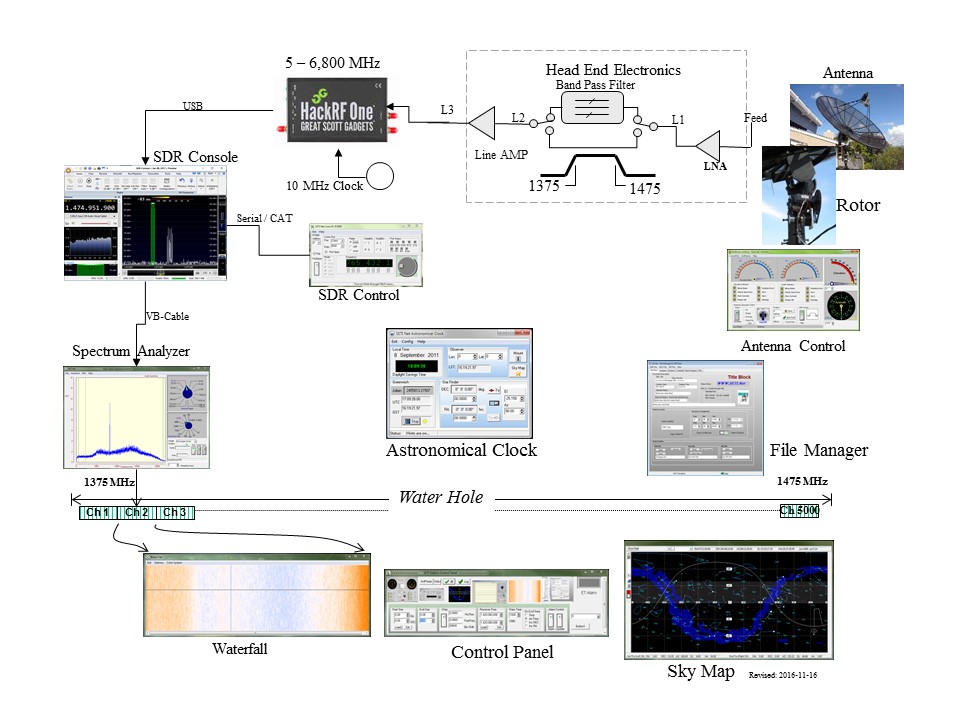
To understand the operation of SETI Net, it's best to start at the station from a system level picture of the station (below). Notice that the diagram is organized from top right moving counterclockwise to the Display (bottom right). This represents the path of a signal entering SETI Net and will be used to describe the station. You may click on any of the icons in the Operating Block Diagram for a description of the modules.
 Please Note:
The new Microsoft Edge browser whines and complains about all my software. You can disable its Defender SmartScreen this way:
(1) Windows Start select Settings then Update & Security
(2) Select Windows Security
(3) Select App & browser control
(4) Turn off SmartScreen for Microsoft Edge
Quick Start
Questions - CommentsQuestions - Comments eMail Me - I will respond..
I will respond.Dish and Horn - Signals reflect off the mesh covering of the antenna surface and enter the Horn. The Horn delivers the signals to the Feed Probe of the Low Noise Amplifier (LNA)
Head End Electronics - This weather tight equipment case that rides on the Horn so that it can be as close as possible to the Feed Probe. It consists of a LNA, a Band Pass Filter (BPF), a relay that can switch the BPF in or out and a second amplifier called a Line Amp. The primary purpose of the LNA is to set the noise floor of the system.
Receiver - This is a Software Defined Radio (SDR) that can be tuned, by the SETI software over the range 1-6 GHz . It can be tuned in 1 Hz steps making it ideal for the 'chirp' algorithms to work.
Digital Signal Processing (DSP)- This module consists of a standard Sound Blaster type card that accepts the 20 KHz audio and digitizes it.; The digital audio is then passed to the SpecAna.
Spectrum Analyzer - The Spectrum Analyzer routes the digital audio to a Fast Fourier Transform. This mathematical operation moves the signal from time domain to frequency domain. The frequency domain is the mode used for the search. When one Frame is completed (about 10,000 scans of the 20 kHz segment) the Detection logic kicks in and searches for the any lines. Lines indicate that a signal is being received. If there is a line and if it exceeds certain thresholds levels it sets off an alarm, starts recording the signal on the hard disk and locks onto the current antenna position and receiver to its current frequency. Its then up to the operator to falsify the signal.
Waterfall - As the SpecAna is creating the Waterfall it is also putting the encoded data into a large data array. On a hit this JPG is saved along with the WAV data.
Sky Map - This is a graphical representation of the sky above the current SETI Network station. From it you can see, at a glance, where the antenna is pointed and if it is locked in position or in drift scan mode.
SETI Net Control Panel - This module ties the Operation of the others together to make the actual SETI Station. Normally the Control Panel remains on the operating screen and the others are called in as needed.
Database
Sounds of SETI
When the SETI Network software detects a signal that needs attention this is the sound that the operator hears:
 Sound Of a HIT
That's what I hear. Others may hear this:
Song of SETI
Antenna
Set Up Antenna (32 bit stand alone application).
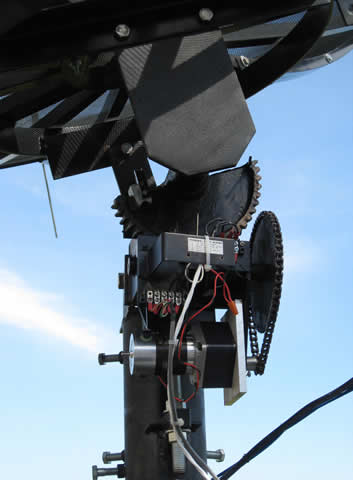
The SETI Net home station antenna (DM12jw) consists of a 10 foot dish and twin rotors each with 180° of movement. The rotors are stacked, using a specially built adapter so that combined they can position the antenna nearly any where in a 360°of azimuth and 90° elevation. Each SETI Net station will have a different antenna positioning system
This is a video of the home station dish moving
Movement Visualization Tool. During the creation of the software to position the antenna I constructed this movement visualization tool. It served me well.
SRT Dish. The home station dish is an off the shelf Television Receive Only (TVRO) from the last century. The dish and rotors were produced by MIT for a project they called the Small Radio Telescope (SRT). It was heavily modified for this station.
Controlling the antenna
Access - Start the control panel if needed and click on the Antenna Controller icon (top left). If the antenna comes on with a different view than above click on the right facing arrow on the bottom and it will open up.
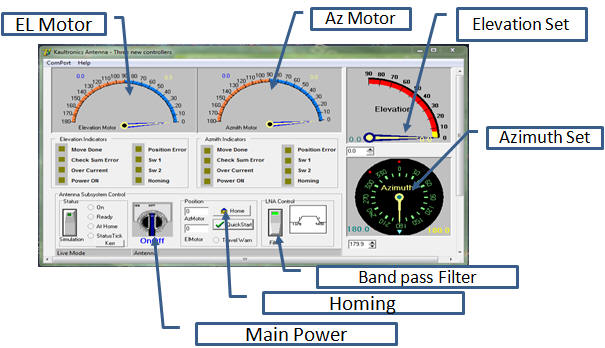
Power On - When you start the SETI Net antenna controller by double clicking on the icon you are presented with this image. Turn the subsystem on by setting the Main Power ON/Off switch. This enables the motors and clears the software ready for Operation. Press the On/Off button and if the antenna is not already at its mechanical stops it will start to move toward them. It may be that the incorrect serial port has been selected by the last user. In this case the antenna On/Off switch will automatically switch back to off. Use the Com Port menu (top left) to change to another port and try again. Usually the port is either 3 or 4.
Homing - Notice that all the gauger's slam to zero when you start homing. When you reach home they will go to there mechanical stop positions. The minimum elevation is currently set at 6 degrees. This is shown by the yellow band on the Elevation Set gauge. The Azimuth Set gauge moves from 180 degrees (straight south) to 355 degrees (almost south again). The mechanical stops on the azimuth system determines the maximum position. When you achieve home the status bar (bottom of the controller) will show 'Ready for HowStuffWorks'. The yellow needles will all be enabled ready to move the antenna as you wish.
Movement - With the antenna system on and the homing HowStuffWorks complete you simply 'tug' a yellow needle, with a left mouse click and hold, to the desired position. As the antenna ramps up to slew speed you will see the second needle move to show the current antenna position. You can tug either of the 'Set' needles (Az or El) or the motor needles. All needles keep up with each other. When the antenna reaches the desired position it will ramp down and stop.
Simulation - If you shut down the motors, with the main power switch, you can turn on the simulation software that mimics the HowStuffWorks without moving the antenna. This is useful when the antenna is off line for repairs or when you want to simply get used to the HowStuffWorks panel. In simulation mode try moving the Azimuth dial to about 210 degrees. This forces the antenna to go 'over the falls' where it turns itself completely around in Az and El to reach this point.
Quick Start - It is possible to start the antenna without going through the homing HowStuffWorks.; After turning the Main Power to On you can press the Quick Start button rather than the 'Home' button. The system will load the motor control logic with the last known position and then go to the ready state.
Band Pass Filter - See the description below
The antenna was developed by the Haystack Observatory (part of MIT) for use as a continuum and spectral line observations in the L-band (1.42 GHz.
|
|
||||||||||||||||||
The focal length of the dish based on dish geometry is 46.85 inches. From the calculation of the feed horn dimensions the focal length should fall inside the lip of the feed horn by 1.46 inches.
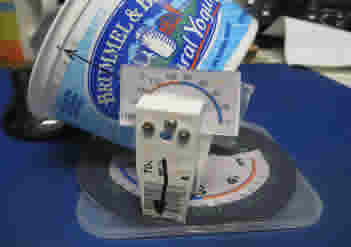
Head End Electronics
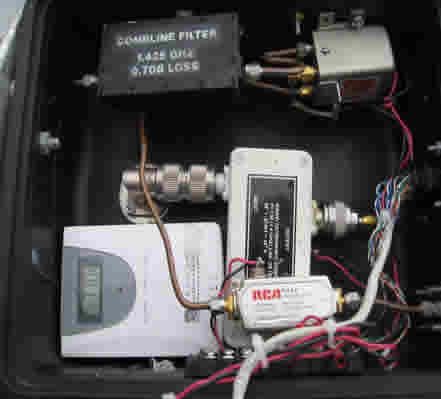
The Head End electronics are contained in a watertight box riding on the back of the Horn. It is mounted as near to the feed probe as possible to minimize loss in the system. It houses the Low Noise Amplifier (LNA), the band Pass Filter (BPF) and various other relays and amplifiers. The remote sensor thermometer (the white box) is not normally part of the Head End electronics.
LNA - The Head End Electronics contains the all important LNA and BPF. The LNA is the white with black label object in the middle. You can see the 'N' type connectors on the left side of the LNA making a right turn down to the probe pickup inside the horn.
BPF and Bypass relay - The 30 dB Band Pass Filter is the black device at the top marked 'Comb-line Filter 1.425 GHZ'. Its the BPF that sets the limit on the portion of the band that reaches the receiver. The BPF is required to eliminate out of band signals from distorting in band signals. If strong out of band signals are allowed to enter the receiver they mix with in-band signals and produce images that may show up anywhere in the band.
The receiver will tune from 1 GHz (100,000,000Hz) to 6.8 GHz. You may tune the receiver any where in this band. Notice that if you wish to view the Global Positioning Satellites (GPS) at 1575.42 MHz you will have to shut off the BPF because this frequency is above the BPF cut off. You can bypass the filter from the Antenna control panel (middle of screen).
Band Pass Filter
Band Pass Filter Characteristics
The BPF can be bypassed engaging the microwave relay (top right in the picture). It is switched in and out of the circuit by software command from the Antenna Control software ('Band Pass Filter switch').For SETI work the BPF is set in line. For Radio Astronomy this filter is bypassed for maximum signal.
The BPF relay is controlled by a Kerr module mounted out of sight on the lid of the weather proof Head End Electronics case. Its this Kerr module that makes the connection to the computer using an Category 5 cable. This is the same sort of cable that is used, with RJ45 connectors, to interconnect computers and routers for Internet use. This cable is actually operating using a variant of the standard RS-232 protocol (RS-422) to control the relay and the twin motor control modules in the antenna rotor.
Line Amplifier - This little device (marked RCA in the picture) is wide band and is intended to make up the loss expected from its output to the input of the receiver. This is a run of about 50 feet and consists of high quality semi-ridged co-ax. The Line Amp is currently removed.
Notice the use of copper colored 'hard lines' to connect the components. At this frequency (1420 MHz) losses need to be minimized by the use of this type of 'plumbing'. A hard line is a copper tube filled with Gore-Tex material and a solid inner conductor of copper. The ends of the copper tube are terminated with low loss 'SMA' type connectors. Hard lines are expensive and difficult to work with but necessary at this frequency.
SDR Console
I use the SDR# software to control the HackRF One receiver. This software has a completely developed user interface and a smooth operation that I could not create. It can be downloaded here:
The interface between the SETI Software and SDR Console uses two serial channels on your computer. I recommend using virtual ports rather than actual hardware.
Once set up and running you may substitute any SDR receiver hardware in the system that you like. If SDR Console supports the hardware - you can use it on your SETI station.
Make sure to get Simon Brown's latest version and be sure to donate to this worthwhile project.
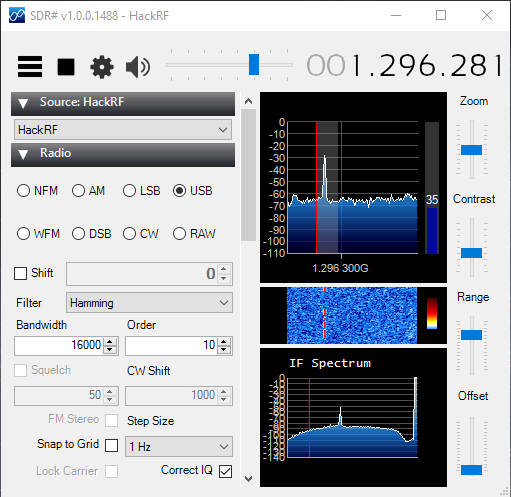
HackRF One Receiver
The HackRF was chosen for several reasons.
- Cost - You can buy these from China at about $100 and they are everybit as good as the NooElec version for $300
- Coverage - I need a receiver for 1 to 5 GHz and this has that plus a bit more
- One HZ tuning - necessary for the search algorithm I use
- TCXO add on - This little module can be added to the HackRF board to give good frequency stability
- 10 MHz external Clock - I want to be able to lock the receiver to GPS via this input
- DDE Control - The SDR Radio software allows me to control the receiver using my own SETI software
- External LNA - The small external LNAs available work nicely as a replacement for the Hack's internal amplifier
- Nice Metal case - For a very small price you can enclose the Hack in a nice looking case
- Prime Focus possibility - I have always wanted to experiment with moving the receiver up to the Head End equipment box.
- Software savable - There are several Windows based software packages for the Hack. Its primary a Linux based machine
Its not without down points for sure
- Its an 8 bit machine so it is not capable of reproducing the incoming signal as other systems
- Lots of images - It need a good front end filter to be usable in any kind of RFI
- Its kind Long in the Tooth now. Ive had mine for several years now and other designs are using more modern chips
- Seems to have a lot of Birds. On the other hand my environment is flooded withe RF sources
To use the Hack first run the Zadig driver installer then connect the device to your PCs USB system. Make sure it is recognized.
I use SDR Radio software because it allows DDE control and it has a nicer tuning system. Other software is avable.
While I was working with the Hack, trying to understand how it operates I became incensed at the command line keyboard pounding I had to endure (poor me) so I wrote this tool that helps a lot. It really is a front end for the Hack DLL (hackrf.dll). You can use it to recover your Hack's board ID , firmware version and serial number (press hackrf_info top right). It is also useful when you want to send a single command to the Hack or transfer a file.
(Download HackRF_Tools for Windows - 64 bit Windows only). I can produce a 32 bit version if anyone would like it.
This software is under development now and will change.
The HackRF One receiver is being created for a replacement of the ICOM R7000. It has a full coverage up to 6.8 GHz and can be tuned in 1 Hz steps. It also can be connected to a GPS phase locked 10 MHz clock for very good stability even in the microwave band. It does, however require development of the control software and this is the first step.
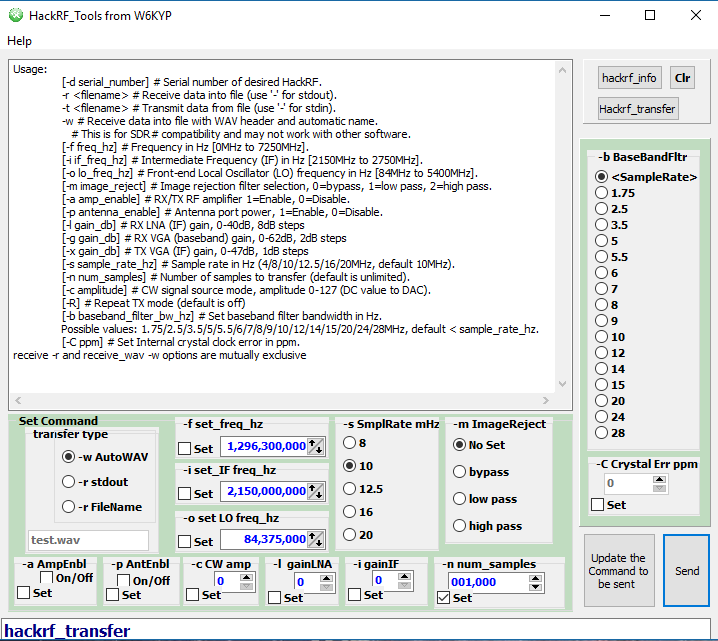
HackRF_Tools - This first application simply allows the HackRF receive to be set to a desired mode and to transfer a block of data to the file system. It makes use of the command line tools from the Hack development team (hackrf_info.exe and hackrf_transfer.exe).
- Install the application into a directory where you have read/write access for the files that are created.
- Start the application and press the top left button 'hackrf_info'. This will access your hack and return basic information of the hardware.
- Press the hackrf_transfer button and the usage screen of the software will appear. This access the software only so it will work without the hardware attached.
- Press the Update button and the command stream will be created from the controls in the Set Command window. Press 'Send' and the command will be routed to the hardware for execution.
- If you un-set the check box for the number of samples a second window will appear to allow you to kill the process before it eats your hard disk alive.
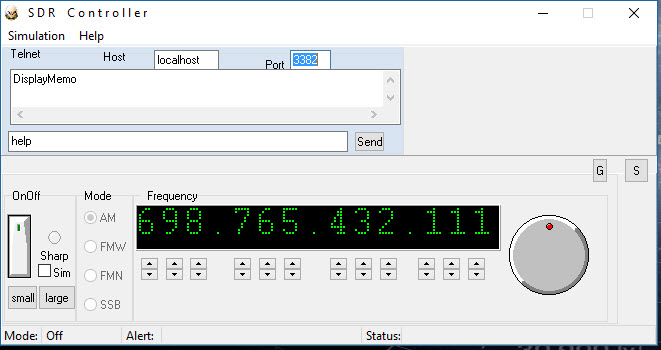
Receiver Control
This module is part of the SETI control panel. It forms that serial port connection between the SETI Software and the SDR Hardware. It uses the CAT protocol for receiver control. You can tune anywhere in the band 5 to 6,800 MHz from either the SDR Console or from the up/down controls or knob on this application
OnOff - Toggle the On/Off to the on position and verify that the green LED is glowing. This signals the connection to the SDR Console app is up and running.
Small Large - Click to save space on your display.
A version of this software for the ICOM R7000 is available here (in RAR form only)
Spectrum Analyzer
Download SpectrumAnalyzer 32 bit (32 bit or 64 bit Windows)
Download SpectrumAnalyzer 64 bit (64 bit Windows only)
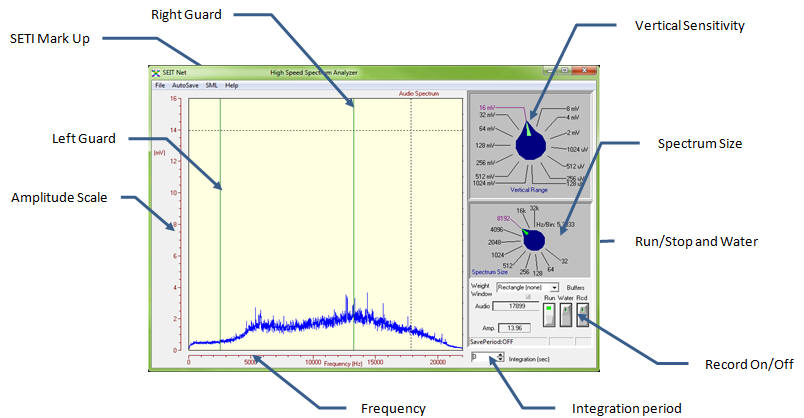
The Spectrum Analyzer is the key component in the station HowStuffWorks. Its task is to accept the raw audio digital data from the sound card and convert it to the time domain for further analysis. It also contains the Waterfall and the detection logic to alert you when you have discovered the worlds first ET.
The Spectrum Analyzer *Must* be run on a 64 bit Windows operating system. This is because of the ministerially large memory buffers it needs when searching for ET signals.
Start the control panel if it needs it and click on the Spectrum Analyzer icon (top). If the SpecAna comes on with a different view than above click on the right facing arrow on the bottom and it will open up.
Spectrum Size - Change the Spectrum Size selector from its default position of 8192 to a smaller number like 1024. Notice that the spectrum display freezes and 'Run' switches to Off. Set it back On and the display will start running again. Notice that the display is much more 'jittery' at a spectrum size of 1024. Switch to 16k on the Spectrum Size control and restart the SpecAna. Now it is much slower but the display is much finer grained. Its slower because it simply takes longer to process a 16,000 point array than a 1,024 array.
Notice the Hz/Bin number next to the knob on the Spectrum size control. At 16k it is a little less than 3 Hz/bin. More about bins and spectrum size calculations later.
Start/Stop/Record - Hit the Run button. If you have the receiver up and running turn it on the Spec Ana (the Run switch on the right) and you should see the output of the receiver in the time domain. Use the Vertical Sensitivity control to set the signal so that it fills about 1/2 the screen and add 1 or 2 seconds the Integration Period control. You screen should look something like the one in the example above.
Water - Toggle the waterfall button and the spectrum will appear as a waterfall. The waterfall is set to be as wide as you have the Spectrum Size set for. That is if you set a Spectrum Size for 8192 bins you will have a waterfall that is 8192 pixel wide.
Capture - Starts recording the incoming audio as a WAV file and the waterfall as a JPG when you stop the capture HowStuffWorks the WAV and JPG files will be created and tagged with your SML. The file names are created automatically based on the Date and Time.
Home Gamers Please Note:
Connecting the output of the SDR to the input of the SETI Net Spectrum Analyzer was a pain in the ass (for technical reasons) but is now much simpler. I Use VB-Cable for the task. You should as well:
You can find the setup instructions here.
Waterfall
Download is part of SpecAna
 The Waterfall is where the detection takes place. Its job to to maintain a buffer in memory that represents the values collected in each bin of the Spectrum Analyzer FFT HowStuffWorks. It gives you a peek at this buffer on the screen as shown below.
Access - The Waterfall is built into the Spectrum Analyzer. To see it in HowStuffWorks do the following:
-
Set the SpecAna Spectrum Size control to 2048
-
Run the SpecAna
-
Press the 'Water' switch next to the Run switch
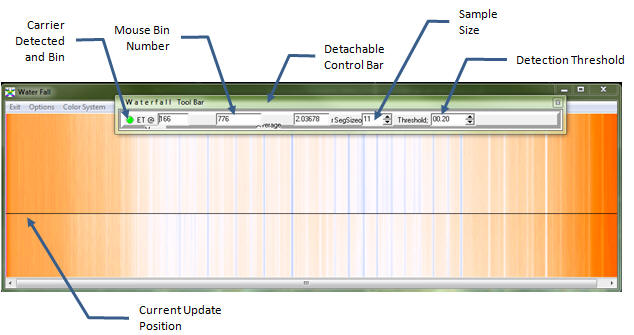
Water Window -You should see a display something like shown above. In a waterfall display your looking at the same display that is presented on the SpecAna except that each pass through the array of time domain data is presented as a single colored line across the width of the waterfall. Each pixel of the line represents one bin of data and is color coded to indicate the relative amplitude of the signal found in that bin. Cooler pixel (bin) colors are toward the red end of the spectrum, hot towards the blue end. When one line is color coded and written to the window the display shifts down one line and repeats the process. The result is a display of that portion of the spectrum where time runs from top to bottom and frequency from left to right.
Window Width -The number of pixels used is equal to the size of the spectrum size so this waterfall in this example is 2,048 pixels wide. If you increase the SpecAna Spectrum Size the waterfall expands to accommodate it. The width quickly expands past the right side of the display but a scroll bar appears below the display to allow you to move right.
Tool Bar - This bar is located at the top of the Water Window but can be dragged off to allow you to scroll the Water Window and still keep the tool bar. This bar indicates that a signal somewhere in the window has exceeded to the parameters necessary to be defined as a 'Hit' when the green LED comes on and the bin (pixel) position where the carrier signal can be found. Other controls in this tool bars will be defined later.
Water/Spectrum display interaction - If you are tuned to a portion of the band where there is a signal you should see the 'Et-detected' LED go green and the bin (pixel) that holds the signal show up next to it. If you move the mouse to the Waterfall and put it over the alarm bin you should see a dotted vertical line show up in the SpecAna display that corresponds to this same position. This HowStuffWorks is less than perfect because of the processor time needed and the dotted vertical line may jerk into position rather than show a smooth operation. More on the other settings later.
Search Control
Download Setup SETI-32 bit (32 bit Windows Windows)
Download Setup SETI-64 bit ( 64 bit Windows only)
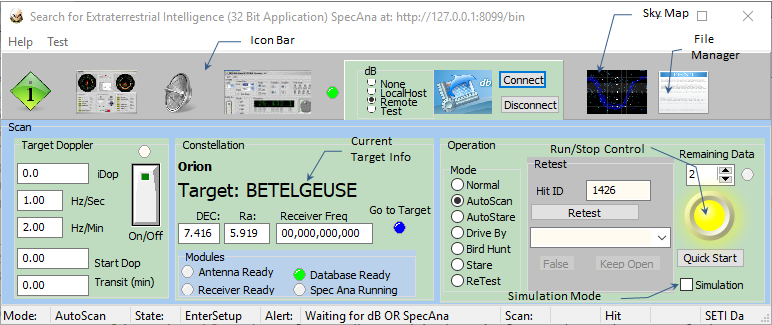
Search Control integrates all the other SETI Net modules and allows you to make visible or dismiss each module from view during use. This is important, particularly when using a computer with a single monitor, to keep the confusion of multiple modules running at the same time to a minimum. The Control Panel also ties together certain functions of modules for a larger picture of what is going on.
Some of the icons in the Icon Bar (across the top of this screen) might be familiar. Left to right:
| Status | Controls the information going to the SETI Net web site front page. |
| Antenna | The Antenna Controller |
| Mount | Defines the Min/Max of Az and El and the No Fly Zone of the rotors |
| Receiver | Frequency and mode setup for the receiver and 10 kHz bump button |
| Database | Press to see the current database |
| Sky Map | Show/hide and control the antenna position |
| File Manager | Generates and tags the JPGs and WAVs with SML |
Each icon is live - that is if you click it the underlying module will spring up for you to control. When you have the module set the way you want it another press will dismiss it and a double click will keep it in view.
There is a MySQL data base in use that keeps track of 'hits' in the system. Each time the system ET Found light (in the Waterfall control panel) lights the details of the station is added to the data base. This allows the system to skip known when there address space is searched again.
Chirp - The ability to chirp the receiving system is the principal method of discrimination of local, terrestrial, signals and those from outside of the Earth. The Chirp system is simply turned on or off here and the current chirp value reported. The Hz/Sec shows the current frequency change computed for the antenna direction. More on chirp in the discussion on Search Strategies.
Receiver Freq -This panel reports the current frequency of the receiver in use.
Mode - This panel sets the station search mode.
Mount
Down Load is part of the Antenna
This module is used to set the default conditions of the antenna in use. Its settings are used by the File Manager to report the setup when data is collected. Normally there is no reason to change any of these setting.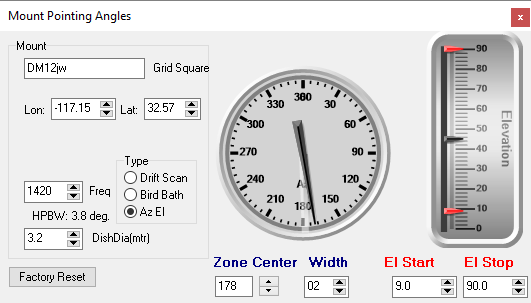
The antenna Mount module allows you to adjust the following items:
Type of Mount - All Sky is the type used currently meaning that the antenna can cover most of the sky from 360 of Azimuth to 90 degrees of elevation. The other possibility is Drift Scan where the antenna is pointed at a fixed Az/El and the sky allowed to 'drift' by. If the mount points straight up its called a Bird Bath.
Pointing Angles - This value is set by the Sky Map Module is is shown here for reference only
No Fly Zone - The Min/Max azimuth and Min/Max and elevation is entered by dragging the needles. This is used to compute the directional setting of the antenna and of the image on the Sky Map.. The Elevation Min/Max is shown by the red arrows and side bars.
Beam Width - The frequency (nominal) is entered here to be used to calculate the beam width. The default is 3.66 degrees.
Changing one parameter effects the others and can become confusing so when all else fails - hit the Factory Reset button to return to a known condition.
Status 
No Download
This module is used to send the current operating parameters to the base page of the SETI Net web site . Turn it on and your current search information is displayed on SETI Net home page.
File Manager
The File Manager is a key element of SETI Net. Its task is to keep track of all the station parameters and convert them to the SETI Markup Language (SML). When the station captures a signal SML data is inserted into the WAV file and the JPG image to make a complete record of what was going on when the hit occurred. It shows who was at the controls, where the antenna was pointed, the time, and a myriad of other details that add meaning to an otherwise file of noise. You can, and should, change at least the Title Page to show your name and any observers with you. After all this will make a record of who actually made the first discovery of ET so make it your own.
Since the station configuration is saved with the data generated a future user would be able to search the station Archives section of this web site for any WAV or JPG files and then extract any particular parameter needed automatically. For example all the Hits the were found between 1420.66535 and 1437.230 could be found in the archive WAV or JPG files. If you wanted to calculate the system noise temperature during a particularly setup you could use the embedded SML as input to these calculations.
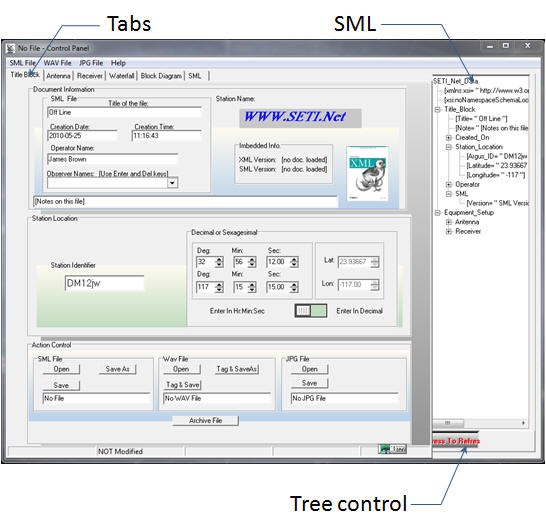
The File Manager has six areas to enter data, Title Block, Antenna, Receiver, Waterfall, Block Diagram and SML
Title Block - This is the main screen that needs personalization for your observation session. Change what you need but remember that Station Location should stay the same (after all that is where the antenna is even if your running it from some other part of the globe).
File |SML | Saves to save a copy of your first changes. I usually call it 'Prototype'. Continue changing the data in your prototype until you are happy with it. Save early, save often.
Antenna - The Antenna tab is a place to put all the technical details of the antenna, its size, current position (automatically updated) the gain of the LNA and all the other items that are needed to identify this equipment.
Receiver - The Receiver tab collects all the parameters that are necessary to identify the receiving parameters.
Waterfall - This tab displays the JPG file when loaded. This screen takes care of itself.
Block Diagram - -This is essentially the same as the System Block Diagram. Its used as a hint when laying out you own SML file. The block diagram is of my own station but should be general enough to relate the parameters to your station.
SML - The generated SML is shown in this tab. Notice that it is coded in XML. The SETI Markup Language is detailed in this section of the web site..
HowStuffWorks - Just before you start a search session open the File Manager and personalize the Title Page. This is how you do it:
>Select the Title Block Tab .
Change the Title, Operator Name, add an Observer if you have on, put any notes you would like to preserve with the file in the single line note area
>Select the SML File 'Saves' button and make up a name for your prototype SML File.
Change to the Antenna Tab and make the changes necessary. Do the same with the Receiver Tab
Save as you go along.
If you have several receivers save a prototypes file for each one under a different name. That way you only have to enter the details once.
Some of the information in the File Manager is updated automatically like the date and time.
The SETI File Manager software allows you to capture the essentials of your SETI station and save that information inside the data file that you generate. Since the information is inside the JPG and WAV files it cannot get lost and will make it possible to identify the station configuration, pointing angles and other engineering information from when the SETI data was collected.To learn the basics of the File Manager its best to play with it. Do the following:
Create A New SML File
The File Manager starts with a built in SML set. Use it to build a personal SML file for yourself.
Save the SML file in a convent file are by clicking on "Save As". The SML is stored in a file with the extension .XML This allows the file to be recognized by other standard XML processing tools.
Modify the current SML by changing any data in any of the boxes.
Save again.
View the raw SML by pressing the "SML" tab. This is the data that will be stored with your WAV or JPG files.
Attach Your SML To A Wave or JPG File
Using the File Manager open any wave file. You will have many on you computer so use the Windows built in search function to find a suitable one to play with. In the WAVE File area (bottom right) select "Open". Then navigate to your wave file. Select the file and press the Open button.
The File Manager will ask you if you would like to use any SML already inside the wave file. if you say 'Yes' any SML in the file comes into the File Manager and overwrites the current SML. No - and only the wave data comes in. If there is no SML in the file it will tell you so and switch to the 'merge' mode
Your wave file is now loaded and has been 'tagged' with the SML data.
Select 'Save' or 'Saves' and store it.
That's all there is to tagging a wave file with SML.
SETI Station Use
Select the other tabs in the generator (Antenna, Receiver and Data Set) and make the changes that describe your SETI station.
Save the final SML file for later.
Search using your standard system software and save the resulting WAV file.
Tag the file with your station profile.
Your file can then be sent to other Argus stations or exchanged with any other user. The file can be played back as if it were live data and the station conditions at the time of collection are frozen with the data.
How File Tagging Works
A Wave file is made up of several 'chunks'. First is a RIFF chunk that that identifies the file as a Resource Interchange File Format. Second comes a Format chunk that identifies the configuration of the wave data in the file (Stereo or Mono, 8 Bit or 16 bit, sampling rate etc). Next comes the Data chunk that contains the actual data. At the end of the long Data Chunk there may be a chunk that identifies the name of the tune or the record producer etc. This chunk is not a requirement.
The File Manager adds a final chunk, the SML chunk, where the SML data is stored.
You can SML tag wave files and still use them normally. For example you can tag the Windows Start wave file and it will still sound correct on you computer.
Jogs don't use 'chunks' but do allow comments. The JPG comment field, at the top of the file, is where the File Manager stores the SML. As with WAVs tagging a JPG will not change the way it is displayed nor will anyone know about the existence of the SML data unless they have the File Manager.
Clock
Clock DownLoad (32 bit Windows)
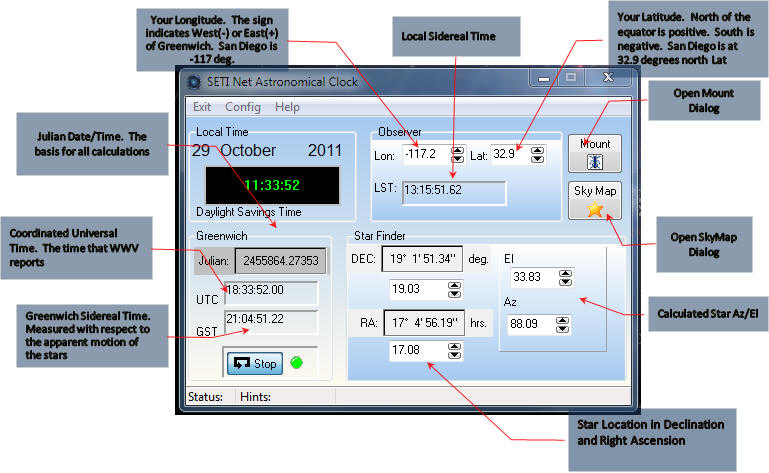
The SETI Net Astronomical Clock is the heart of the system. It calculates the various equations of time necessary to keep the antenna pointed and locked to a place in the sky and to cause it to move to a new star location when requested. When running from the Control Panel the HowStuffWorks of the clock is transparent to you.
The clock can also be used stand alone on your computer. You can use it to find where a star is in the sky and what Azimuth and Elevation setting it would take to point to it.
Setting up the clock
- Start - The clock starts running as soon as you start it. It displays Julian day, Universal Coordinated Time (UTC) and Greenwich Sidereal Time. These are calculated based on the clock in your computer.
- - Enter you latitude and longitude from the Mount. I use Google maps to find mine. As soon as you enter these two values the clock calculates your Local Sidereal Time (LST)
- - Information you enter in the Mount is remembered for the next time you start the clock
- Sky Map - Show your star and antenna pointing location graphically. To cause the antenna symbol to move to the star symbol set the switch on the left side.
Sky Map
Download is part of the Spectrum Analyzer
The Sky Map gives you a visual indication of the portion of the sky you can see from your location. It was built from a Mercator projection of the night sky modified so that Declination bars are shown running up the middle and Right Ascension bars from right to left.
This is a Live View of the sky over SETI Net
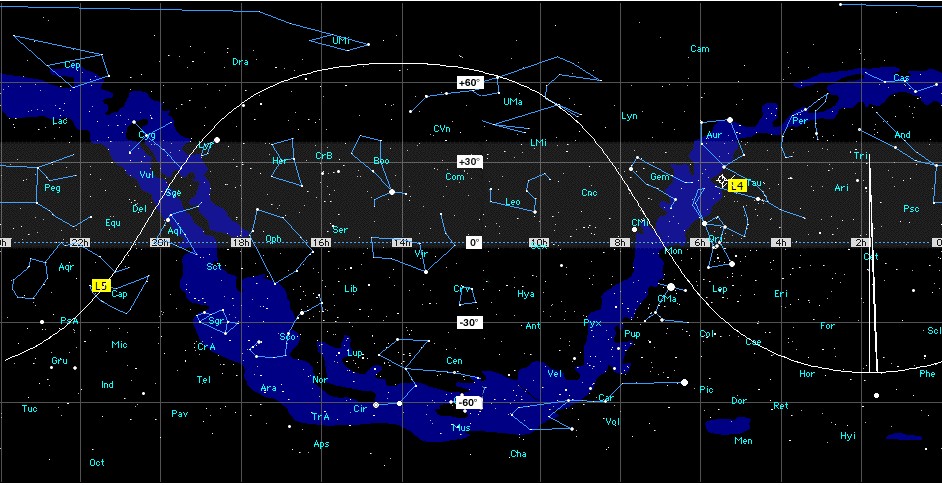
About Mercator Projections
This type of map allows an object that is spherical to be shown as if it's flat. This introduces distortions in the top and bottom of the image but makes it possible for me to use the map in SETI Net. The night sky which is a sphere above you is shown as a flat projection in the Sky Map. The result is that the Milky Way (the blue band) has a curve to it.
With the Sky Map you can see the position of the major constellations of the sky in both Azimuth and Elevation or Declination and Right Ascension. The DEC/Ra is fixed in the sky and the Az/El changes as the day progresses. You set the Sky Map to your location using the stand alone Clock and Mount. For SETI Net the location is built in.
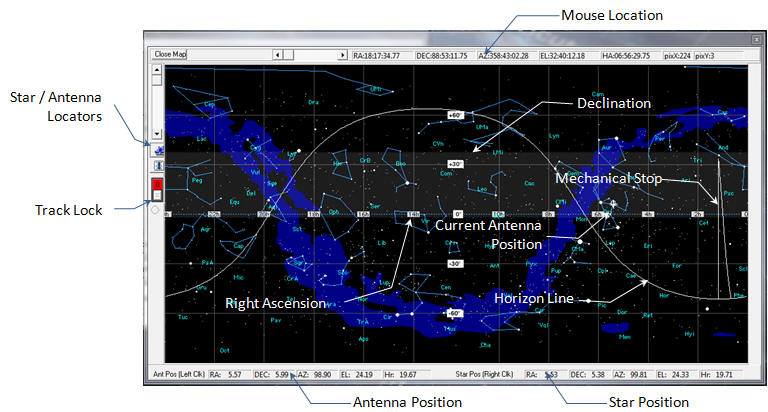
Access from SETI Net - Start the control panel if it needs it and click on the Sky Map icon. You should see the Mercator projection of the sky shown above. If both the Radio and the Antenna are on line and if you select 'Update' on the Control Panel you should see the Horizon line and the Mechanical Stop. Other wise you will just see the sky.
Mouse Location - Move your mouse of the map and notice the change in the top status bar. This bar calculates the position of your mouse pointer as you move through the Sky Map. It shows you the following:
Ra - The Right Ascension of the mouse. This is calculated from the current date and time as reported by the SETI Net computer the the location of SETI Net in latitude and longitude. You can think of Ra as the movement across the horizon (its not really that but its a way to keep your sanity). This is indicated in Hours | Minutes | Seconds and milliseconds with zero hours on the far right and 23 hours, 59 minutes on the left.
DEC - The Declination indicator is also calculated from the date/time and the location of SETI Net on the globe. You can think of DEC as the up/down movement of the SETI Net antenna. Again its not really up/down but it can be visualized that way. DEC is calculated in degrees with zero degrees in the middle of the Sky Map running up to +90 and down to -90. DEC is indicated in Degrees | Minutes | Seconds
HA - This is the Hour Angle of the mouse position. Hour angle is an intermediate value used during the calculation of the DEC and Ra and is shown for interest only.
pix and pix - These are the pixel positions of the mouse pointer. They are used in the calculation of the other values and have no value other than interest.
Antenna Position - The current Antenna position is shown on the left side bottom of the Sky Map. Changing the antenna position is done by mouse left click.
Star Position - This sets a point in the Sky Map as your star selection. Make your star selection with a right click. The Star and Antenna positions are show in major units (Hours in the case of Ra and Degrees for DEC) and decimal portions of those values. This is different than the mouse position indicator which is in hours, minutes, and seconds, and allows you to work with either scale.
Mouse Action - Move your mouse to any place in the Sky Map and Right Click the mouse. From then on the current star selection is shown in the bottom right of the Sky Map. Left click any place on the Sky Map and the antenna starts to move to that location.
Star/Antenna Locator's - If you loose track of where the antenna star is you can press the left side icons and see the current location.
Track Lock- If you set this switch on the antenna will start to move to your current star selection and when it reaches it it will maintain this position for as long as the star remains above the horizon line. This is useful for long integration time searches. A green LED will come on below the switch indicating lock condition. Of course if you are using the stand alone clock this switch has no effect.
The Track Lock switch and LED does not show when running the clock 'stand alone'
Mechanical Stop - 355 degrees it hits a mechanical stop to keep it from strangling its control cables. The antennas minimum elevation is +6 degrees but it does go up to +90 degrees. These two values are used to compute and display the mechanical stop figure on the Sky Map. It looks like a misshapen triangle because of the distortion caused by the Mercator projection. If your command the antenna to move to the right of the mechanical stop the antenna will 'turn itself inside out' or 'go over the falls' by rotating though 90 degrees of elevation. Don't do this HowStuffWorks very HowStuffWorks as it puts maximum strain on the antenna rotor motors.
Horizon Line - The horizon is of course a straight line when you look out your window but because of the Mercator distortion is appears as a sine wave in the Sky Map. The area below the line is below the horizon and of course you cannot move the SETI Net antenna lower than the 6 degree minimum elevation.
The horizon line moves across the Sky Map, from right to left, as the day progresses. It carries the Mechanical Stop with it so that when it meets the SETI Net antenna the system causes the antenna to 'go over the falls' and continue to track its star position on the right side of the mechanical stop. This is an impressive thing to see as the antenna turns its inside out to reach the new position.
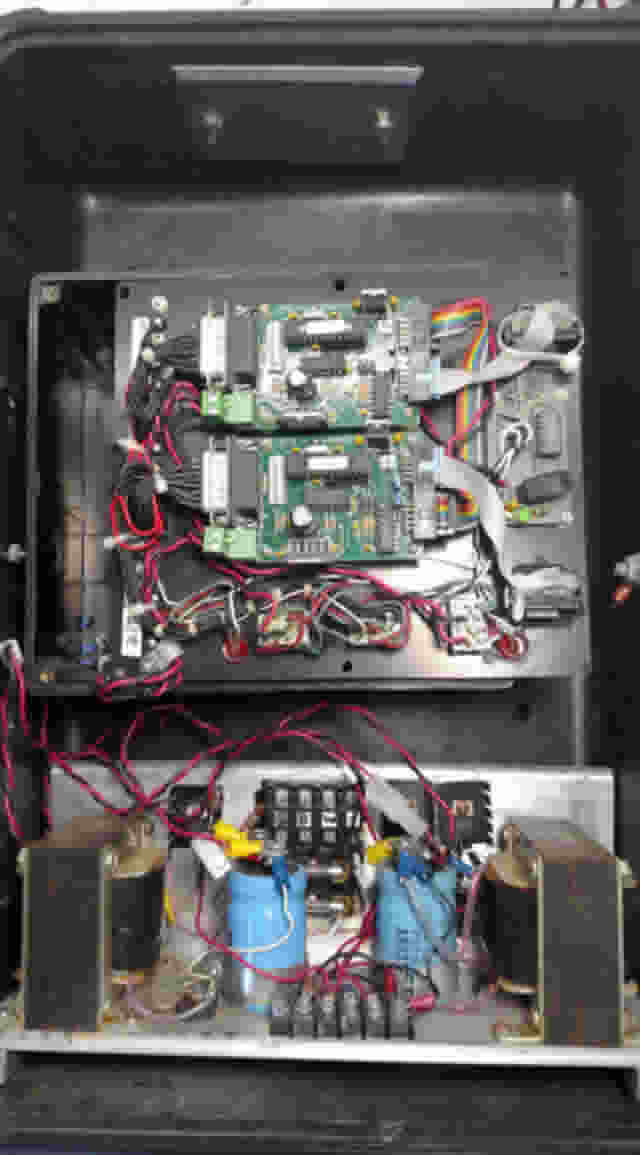
Control Box
The Control Box is mounted at the base of the antenna and serves as local control of the antenna for service and test and as a shelter for the twin rotor motor controllers.
ET Simulator
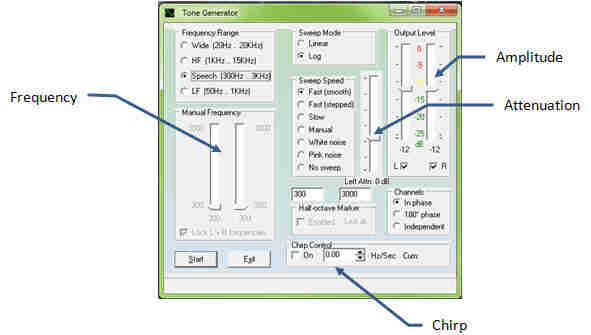
Use the ET Simulator to create a signal that the Spectrum Analyzer will find correctly. Set the frequency and amplitude and if your set the tone to chirp down in frequency by a specified amount. If you are synthesizing a very low level SETI signal you can add attenuation to the signal to get it down very close to the noise floor. Chirp is a technique described in the Water Hole section.
There is a White Noise generator built into the ET Simulator that can be used to test the audio system on your computer
he system is setup with Virtual Audio Cable (VAC) so that the ET Simulator audio to be routed to the Spectrum Analyzer. More on this in the section on Audio Connections.
Water Hole
The water hole is a place, a frequency, a concept and a poem. Its very important and deserves a write up of its own which is here.